
|
|
Analyzing DIY Vibration Acceleration Data
Search Vibrationdamage.com
|
|
|
|

Search Vibrationdamage.com
|
|
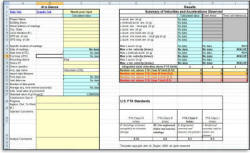
Most iOS (Apple) and Android-based devices have built-in accelerometers (devices which detect and measure accelerations), used to determine the device orientation. They can also be exploited to measure vibration accelerations, within the limitations of the devices. This technology makes vibration monitoring accessible to most people at little or no extra cost. Such devices are becoming increasingly used for scientific study of vibrations worldwide (e.g. for measuring road vibration inside vehicles). The CVDG Pro chapters DIY Vibration Monitoring, Setting Up DIY Vibration Monitoring, and Using DIY Acceleration Data all provide information on properly setting up and using mobile devices to measure vibrations. Because the vibration acceleration data are the rate of change of the vibration peak particle velocities measured directly by seismographs, a somewhat different approach is needed to analyze them. In this chapter, I'll discuss how to analyze and interpret mobile device vibration acceleration data, using a paste-in spreadsheet template which I have created to greatly speed up the analysis. Near the end of this chapter, I'll tell you how to get the template free to analyze your own device-generated vibration acceleration data. Measurement Axis Orientations In Apple and Android devices (and many others), the positive z axis points perpendicular to the screen surface when the device is held in a vertical position; the positive y axis runs along the long dimension of the device screen, pointing upward when the device is held vertical and reads correctly; the x axis runs to the right along the short direction when oriented the same way. If the device is set on its back, rather than being held vertically, the vertical axis can be either the x or y device axes. If you haven't set up the device recording app to compensate for local gravity, the vertical axis in your installation is easily identified, because it will always show a value very near + or -1 g, depending on the device orientation. Ideally, whether you have the device sitting on its back or mounted upright on a wall surface, you will orient the long direction of the screen toward the work site, as this will assure that all the axes are pointed in the same direction each time you record data. In the graphic, the orientation of the monitoring device (an iPad) was such that the y axis is the vertical one.A Spreadsheet Vibration Acceleration Analysis Template Because there are few standard limits worldwide for acceleration due to vibration, the axial acceleration values must be analyzed, integrated numerically and the result converted to the generally accepted units of peak particle velocity (PPV), in units of mm/sec or in/sec. The basic equations and calculations describing the relationship between acceleration and velocity are fairly simple (see Using DIY Acceleration Data for the equations). However, when you must deal with observations on three axes at 300,000 or more different times, as is typical of device-recorded data, even the simplest calculations can become burdensome. A spreadsheet template in which the calculations are done automatically, once you paste in the raw data, is a tremendous time and work-saver. I have prepared such a template for spreadsheet analysis of acceleration data obtained from mobile devices. It's basic features can be seen in the screen image below:
The template includes a section for documenting the information about the way the data were recorded (At a Glance) and its most basic features. Another is for displaying the most important Results of the calculations. The Calculated Values Area (in aqua) includes the formulae necessary for analyzing the accelerations and converting them to velocities by numerical integration. The Data Import Area (light green) is where you paste your cleaned-up data. About Device Accelerometer Data
As the image on the right shows, the observed accelerations are quoted as fractions of the earth's standard gravitational acceleration, g (about 9.80665 m/sec2, depending on altitude and latitude). The vertical axis (y in this case) can be corrected for the local value of g by calibrating the device in the application, although that wasn't done in collecting these data. If you don't calibrate the device, then you must compensate the vertical axis for the local value of g by subtracting the ratio of the local value of g divided by the standard value at sea level from the recorded vertical number. If the template detects that g has not been subtracted from the vertical values, it will calculate the local value of g for you, using your provided elevation and latitude of your site. Timestamps On Mobile Devices Timestamps from mobile devices may look a little strange at first (e.g. the actual vibration data shown in part in the image at right), because both Apple and Android devices use Unix-type time stamps. You need to format the timestamp cells as numbers with five decimal places and adjust spreadsheet column width as necessary to see all the information in the timestamps. You can use an Excel formula,=(((CellTS/60)/60)/24)+DATE(1970,1,1), where CellTS is the first cell containing the time stamp, in a separate column to convert the time stamps to Excel serial time values. Simply copy that formula down to all the other cells in that new column to translate the other Unix time stamps into the Excel serial times used by spreadsheets. Formatting those Excel serial times as dates and times in Excel gives you a human interpretable date and time in Excel and other spreadsheets which use its time format. The template does this automatically when data are pasted into it. Cleaning up the Data If you see extra blank rows between each row of data in the imported files, as seen in the example above right, you can, and should, get rid of them by first selecting and then sorting all the data (Data,Sort in Excel) by the Unix Timestamp column in Ascending order. This will have the effect of moving all the blank rows to the end, where you can clear or simply ignore them, when you paste it into the template proper. You can also clear the empty rows by manual deletion one at a time, but that is impractical when you have 300,000 or more rows, as is typical of many acceleration data sets from mobile devices. Note that the template expects the data columns in the following order left to right: timestamp, x-axis, y-axis, z-axis. Some vibration monitoring apps will store the timestamp in another location (usually the last column). If yours does that, you will have to move the timestamp to the first column. If your app provides the data in some other order, you will need to move the columns to get them into the right order before pasting it into the template. There should be no blank columns between the columns of data. In the Template Workbook The template workbook, in addition to the main Calculation worksheet, also provides a Help worksheet, which explains the meaning of the various values calculated or entered, as well as basic instructions on how to use the template with a data set. Another Graphs worksheet within the template workbook provides graphical depictions of the data and results. You will need a basic understanding of Excel charts to use the Graph templates to best advantage. Finally, another worksheet (Import Temp) in the workbook gives you a place to import raw data using Excel's Data Import function, if you choose to do it that way, and carry out some basic cleanup on the data before you bring them into the main worksheet Data Import Area. Use of the Template To use the template, you simply paste your entire cleaned up data set into its Data Import Area (just below the green header). Once you've gotten any extraneous formatting out of the way in your data file, select all the numeric data (not the column labels) and choose Edit, Copy. Then, switch to the Data worksheet tab, place your cursor in the indicated cell in the Data Import Area and select Edit, Paste Special,Values. The data will be copied to the worksheet. You are then ready to analyze the data. Once the raw data are pasted into the template, the necessary calculations are carried out and summarized automatically, if you have the Excel options set for automatic recalculation. Documenting the Data
You will need more than just a set of calculations to draw meaningful and defensible Information in light yellow cells is reserved for insertion by the user. When that information is inserted, the yellow cells turn white in color. You should provide as much of this information as you can. If you have documented the installation with photos, this is a good place to insert the relevant photo file names. Once the data are pasted in, those parts of the information calculated from the data fill in the aqua-colored cells. The Results Summary A second part of the template head provides a brief overview of the results of the analysis for easy reference, as seen below. The template counts the number of observations of integrated velocity absolute values[5] above the various U.S. FTA standards. It also identifies the maximum accelerations and velocities seen and provides the cell references for those maxima. The same information can be gotten by surveying the data manually, but it's a great help to have the template do it compared to searching several hundred thousand data points manually. Knowing the cell ranges with the most important data is also a help in graphing the data later (see below).
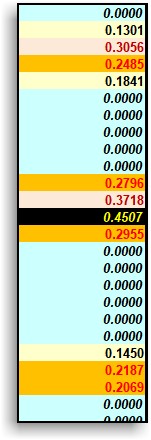
The template calculates the root mean square (rms) noise level of each axial detector. It uses the standard scientific criterion of twice the noise level to consider a vibration acceleration as detected. Vibration accelerations below a signal/noise (S/N) criterion of two times (the default value, user adjustable between 1.1 and 2.5) the rms noise are set to zero in the integration,[2] since they cannot be said to be reliably detected. The template uses the "left-point rectangular" method for the numerical integration. With at least tens of thousands of time intervals in a typical device accelerometer recording, all methods of integration will converge to the same value, so the simplest method is the one used. See Using DIY Acceleration Data for more information on numerical integration methods. Dealing with Data Anomalies I have discussed how to install properly a mobile device for vibration measurements. However, even those cases where the device is set up in accordance with the directions we provide (Setting Up DIY Vibration Monitoring) may still have data anomalies which can complicate calculations of the velocities. The most common of these are ones where data are not taken in some time intervals or time intervals where only partial data are recorded. These show up as zeroes for the measured accelerations. The template counts such occurrences for you, formats them specially in the data and alerts you to their existence, so that you can check to see if they impact your analysis results. Thus, any zeroes in the original data are highlighted in bold red on a white background to make them easy to see and handle. Because of these and other potential anomalies, the formulae which calculate the velocities need to account for and gracefully handle them.[3],[4] The template does most of this for you. Special Formatting
Such highlighting makes it easier to scan through the calculated results and find ranges that may be worthwhile graphing or simply to see how the vibration velocities build with time. Other parts of the template are formatted to call attention to the need for information about the data. Meaning of the Results Most machinery-caused vibrations last for at least a second and have vibration components on all three axes, even if those components differ in value. If you're recording data "at 50 Hz" (i.e. data are taken 50 times per second), even 30 or 40 observations of velocities exceeding standards may not be significant, especially if they are seen on only one axis. This is the reason for the criterion that there must be at least 50 detections of velocities above limits on at least one axis and that there must be detections on more than one vector axis. Looked at in another way, construction vibrations are given lower velocity limits precisely because they last anywhere from a few seconds to hours or more. Vibrations which only persist for only fractions of a second are subject to higher vibration standard velocity limits than longer duration construction vibrations. After you have all your velocity data calculated, analysis of the data can then proceed as with seismographic data. The CVDG Pro has many chapters which will tell you how to handle the information and what to look for in it. The Vibration Data Handling chapter is a good place to start in understanding your data and their meaning. Graphing the Results A more intuitive way to view the data is to graph it in your spreadsheet program. The template I have discussed has a Graphs worksheet within the workbook to provide views of the data. If you're using an older version of Excel, you may not be able to graph all your data. Versions of Excel prior to 2008 have a 32,000 row limit on graphs. Versions of Excel before 2007 have the same limit on the number of rows which can be brought into the spreadsheet itself. Quattro Pro, for example, has long had a 1,000,000 row limit, so, you can use it with very large data sets, too. The graph templates in the Graphs section are very basic because they are intended to provide user with a quick view of the data. If you're familiar with charting in Excel or another spreadsheet program, you can change the basic graphs to ones more to your liking by modifying which rows are plotted, the chart type and the series which are plotted. Advanced Uses of Acceleration and Velocity Data
Getting Your Own Copy of the Template The template for analyzing mobile device-acquired vibration acceleration data is available free from Vibrationdamage.com by request. It is copyrighted and may not be distributed to others. We suggest that users of it have basic familiarity with Excel or any other spreadsheet which can read Excel files. You must be able to copy and paste your data from its original file, after removal of any extraneous blank lines and column headers. We strongly suggest that you carefully examine the resulting spreadsheet for data anomalies, especially when the template alerts you to them. You should also have available as much information as you can about the construction operations ongoing when the data were recorded, the specific location of the device, its orientation and the latitude and elevation of the site of the device. Because the template workbook includes a Help worksheet with instructions for use and explanations of the calculations and results, there is no need for other documentation. Getting the template, subject to the restrictions on use, is just a matter of requesting and registering a copy of the template. You must be a registered owner of the CVDG or CVDG Pro to download the template. It's Worth the Trouble Taking the time to set up mobile devices for monitoring, then transferring the data to a computer and finally analyzing it using a spreadsheet may seem like a lot of work. That work of analysis can be made much easier if you have an analysis template available, but it's still not trivial. The CVDG Pro tells you how to do it right the first time. The Pro version will cost you some money. However, it's far cheaper and easier than paying someone to do seismograph monitoring for you, let alone doing it right. Most construction jobs using heavy equipment are not vibration monitored. Hence, any vibration data taken during the job will assume an outsized importance in the event of damage. It is often, but not universally, true that the construction company is required by contract to do vibration monitoring; many will not do it, despite the requirement. If they do monitoring, they may not want you to know about it. If you recognize that a job is being vibration monitored, you may still want to take your own data, as it's often difficult to get access to the construction company's data, short of getting a court order. Even then, you may have trouble getting any part of it which might be unfavorable to the contractor. Having your own data can help force production of such data. As any real scientist will tell you, there is no desirable substitute for actual data, well-documented and properly analyzed.
|
|
|
E-mail to drzeigler@vibrationdamage.com or send online questions or comments about Vibrationdamage.com.
|

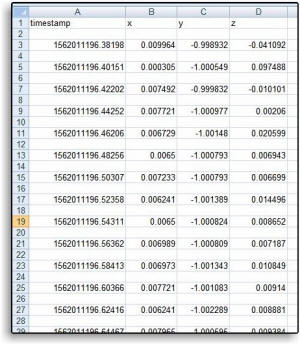 At right is a screen image of the first part of a set of raw vibration acceleration data logged during a major road reconstruction job. They were recorded with a free vibration monitoring app for the iPad
and stored in a CSV (comma-separated values) file, which was imported into a spreadsheet for analysis.
At right is a screen image of the first part of a set of raw vibration acceleration data logged during a major road reconstruction job. They were recorded with a free vibration monitoring app for the iPad
and stored in a CSV (comma-separated values) file, which was imported into a spreadsheet for analysis. 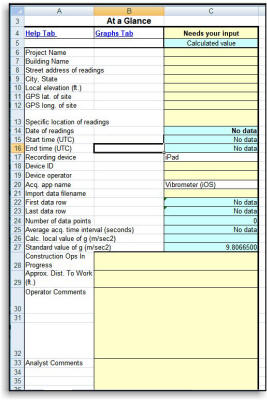 conclusions from the data. In fact, the single biggest problem I see with
"professional" seismograph reports is a near total lack of documentation of how the seismograph was installed and the parameters governing its operation, which makes scientific interpretation and reproduction of the data impossible, even in a theoretical sense. The image at right shows a portion of a
acceleration data template. This "At a Glance" part of the template provides the critical background information (location, name of project, times of recording, distance to the work
and more) necessary to document the data itself, as well as basic aspects of the data (number of data rows, local value of g, time and date of observations, etc.).
conclusions from the data. In fact, the single biggest problem I see with
"professional" seismograph reports is a near total lack of documentation of how the seismograph was installed and the parameters governing its operation, which makes scientific interpretation and reproduction of the data impossible, even in a theoretical sense. The image at right shows a portion of a
acceleration data template. This "At a Glance" part of the template provides the critical background information (location, name of project, times of recording, distance to the work
and more) necessary to document the data itself, as well as basic aspects of the data (number of data rows, local value of g, time and date of observations, etc.). 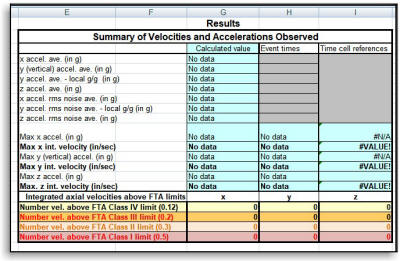
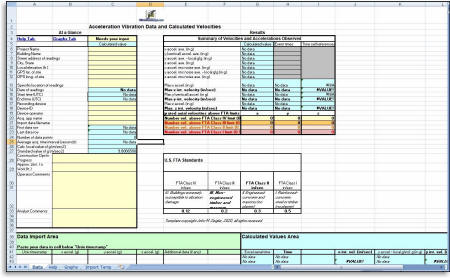
 The template
also uses different special (conditional) formatting to call attention to velocities which exceed the U.S. FTA standards, as shown in some actual vibration data at right.
Calculated velocities exceeding standards are highlighted in the colors shown in the screen shot above, e.g. those exceeding the U.S. FTA Class I standard are highlighted as shown in the screen image at right. The peak velocity
observed in the data is shown in yellow on a black background.
The template
also uses different special (conditional) formatting to call attention to velocities which exceed the U.S. FTA standards, as shown in some actual vibration data at right.
Calculated velocities exceeding standards are highlighted in the colors shown in the screen shot above, e.g. those exceeding the U.S. FTA Class I standard are highlighted as shown in the screen image at right. The peak velocity
observed in the data is shown in yellow on a black background.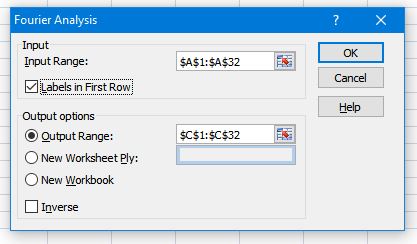 Fast Fourier Transform (FFT) derived frequency spectra, critical to determining damage
potential, can be calculated within Excel. Versions of Excel starting with Excel 2003 and later all have the Data Analysis Tool Pack, although you will have to install it as an add-in. Once installed, Excel provides a
"wizard" in later versions to help you carry out the Fourier analysis. There are some significant limitations to Excel's capability in this area, including a maximum of 4096 data points and a limitation of the number of data points
to a power of 2. These limitations mean that you will only want to apply it to ranges within the data set which show clear vibration detections, not the whole of the data. A basic understanding of how FFT works and what it means
is necessary, but those familiar with Excel can use the wizard easily.
Fast Fourier Transform (FFT) derived frequency spectra, critical to determining damage
potential, can be calculated within Excel. Versions of Excel starting with Excel 2003 and later all have the Data Analysis Tool Pack, although you will have to install it as an add-in. Once installed, Excel provides a
"wizard" in later versions to help you carry out the Fourier analysis. There are some significant limitations to Excel's capability in this area, including a maximum of 4096 data points and a limitation of the number of data points
to a power of 2. These limitations mean that you will only want to apply it to ranges within the data set which show clear vibration detections, not the whole of the data. A basic understanding of how FFT works and what it means
is necessary, but those familiar with Excel can use the wizard easily.