
|
|
Vibration Frequencies
Search Vibrationdamage.com
|
|
|
|


Search Vibrationdamage.com
|
|
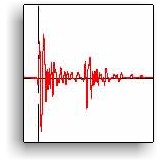
Real ground vibration wave traces from a seismograph, like the one at left, caused by an excavator bucket striking the ground, don't look very much like the simple, regularly-varying sine and cosine waves discussed in the CVDG's chapter, Vibration 101. Vibration waves are usually much more complex. However, ground vibration seismograph traces can be analyzed mathematically to reveal a complex sum of waves of different frequencies, velocities (speeds of particle movement), amplitudes (sizes), and phase relationships (i.e. relative positions of wave peaks in the various components). This detailed information is critical for estimating the true structure damage potential of a vibration. Vibration standards all over the world recognize that the potential for damage from ground vibration is strongly dependent on the frequencies present in the vibration. They set different "allowable" vibration intensities for different frequencies of vibration. Thus, finding out what wave frequencies and intensities contribute to the overall vibration is extremely important in gaining an understanding of its damage potential.
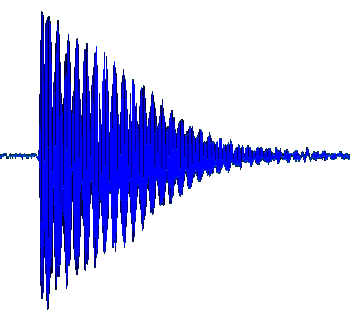
Waves and Frequencies A graph of "amplitude" ("intensity" or "volume") on the vertical axis vs. time on the horizontal axis, for a single piano note sound (a vibration wave in air) lasting about two seconds, is shown at right. The sound wave starts when the note is struck, oscillating rapidly and fading away over time, as shown in the graphic. A well-tuned piano or a tuning fork will have most of its volume at the main ("fundamental") frequency for the note. We could simply count the number of the largest "peaks" occurring in one second in this graphic to get an approximation of the fundamental frequency of the note, in cycles per second (cps) or Hertz, (Hz). However, there are some other little "squiggles" on the large peaks of the graphic which show that there are other, higher, frequencies present besides the fundamental frequency. These are called "overtones" and several of them occur at even multiples of the fundamental frequency. It quickly gets difficult to find out much more than the fundamental frequency by simple inspection of such a graphic. Ground vibration amplitude vs. time plots are much more complicated than this single piano note. So, if we are going to be able to understand the frequency makeup of even relatively simple ground vibrations, we need some help. One way of getting at some frequency information from a vibration is to use what is basically a measuring technique, much like that described above for the piano note. One simply looks at the largest peak in the vibration intensity vs. time plot like the one at the top of the page, measures its width in fractions of a second at the baseline of the waveform (i.e. between the adjacent points where the intensity is zero), then calculates 1 divided by this width (the "inverse" of the width) to calculate the number of such waves which one could "fit" in one second. This number approximates the frequency of the largest peak.
Fast Fourier Transform Frequency Spectra A To learn more about how FFT is done and its many uses (e.g. medical MRI depends on FFT), but especially in ground vibration studies, see the CVDG Pro page, Fourier Transform. FFT can only be done when the full vibration waveform is available. It cannot be applied to a vibration whose only record is a set of PPV's in seismograph histogram data. Comparing ZC and FFT Frequencies Some FFT-derived ground vibration dominant frequencies are compared with the corresponding zero crossing frequencies for the same events in the table at right. In each of these instances, the seismograph was located within 50 feet of the vibration source. Thus, these data reflect the source vibrations, not the formation of "low frequency wave trains" known to be predominant at larger distances, due mostly to soil absorption of the higher frequency components.
There are always differences between the ZC and FFT frequencies; some of the differences are quite large. This is especially true for those vibrations which have broad frequency distributions, e.g. those involving ground impacts. Such broad frequency vibrations cannot be adequately characterized with a single vibration frequency, no matter how derived. Most FFT-derived dominant frequencies are lower than the corresponding ZC frequencies for the same vibration. This is a particularly important difference, since it is the lower frequencies which have the greatest damage potential. For these reasons, it is generally advised that one use FFT-derived frequencies in analyzing vibration data, not ZC frequencies.[2] ZC frequencies should only be used where no waveform data exist to apply FFT, usually due to seismograph Memory Full Exits or "loss" of data. In that case, ZC frequencies should be considered as rough approximations to the real frequencies and given less weight in any analysis of damage potential. FFT Vibration Spectra Unlike ZC crossing calculations, Fast Fourier Transform (FFT) analysis (CVDG Pro) of the vibration waveform provides the full vibration frequency distribution, not just an approximation of the dominant frequency. A full plot of the vibration frequency distribution vs. intensity, like the one at right, is called a "vibration spectrum" and is one of the most useful tools in determining the damage potential of a given vibration. Typically, vibrations generated by mechanical equipment (e.g. engine and other equipment with rotating or oscillating parts) have relatively narrow frequency distributions. Those generated by ground impact (e.g. pile driving, dropping large rocks on the ground, pounding on pavement, excavator bucket strikes) or impact-like activities (e.g. driving tracked equipment, pavement milling) have broad frequency ("broadband", "broad spectrum") distributions, like the impact vibration frequency (in Hz) plot at right. The often quoted "dominant frequency" (the single frequency of highest amplitude) is marked by ▲▼ symbols along the top and bottom scales. These "vibration signatures" are discussed in much more detail on the CVDG Pro page, Vibration Signatures.
Setting aside the inaccuracies of Zero Crossing frequencies, such single frequency-based conclusions have little meaning and virtually no import with respect to the potential for damage, when the vibration has a broad range of frequencies, as in impact-caused vibrations like that of the vibration spectrum just above. The dominant frequency there is about 42 Hz, with a relatively low peak particle velocity of 0.185 in/sec (just below the FTA Class III limit of 0.2 in/sec for timber-framed homes). Thus, most vibration reports would indicate that this vibration would be "non-damaging". However, when we look at the whole spectrum, we find that there are multiple vibration frequencies below the 40 Hz criterion indicated in USBM RI 8507. Moreover, their intensities are very nearly the same as the 42 Hz peak. Many of them overlap home resonance frequencies. Even though the naive and incomplete single frequency analysis would claim this vibration to have been non-damaging, the fact of the matter is that this particular vibration is known from videotape records to have caused additional damage in a home already damaged by the road construction operations, which caused both this vibration and the prior damage. Thus, conclusions in vibration monitoring reports based on single zero crossing frequency analyses, especially when there are no available FFT-derived vibration spectra and no detailed information on the construction operations occurring at the time of the vibrations, should be viewed as poorly supported, at best. They may well be literally invalid, as they were for this vibration. This topic is discussed in much greater detail on the CVDG Pro page, Reporting Vibration Data. Frequency and Damage Potential
Blasting vibrations have shorter durations than the vibrations in the homes which they produce.[3],[4] On the other hand, construction vibrations last much longer than either blasting ground vibrations or ground-vibration caused home vibrations, so there is a greater opportunity for amplification in the house vibration.[6] Unfortunately, there are few, if any, scientific studies which examine home resonance effects from long-lived construction vibrations. While the dominant ground vibration frequencies vary in mine blasting, depending on the setting of the blasting,[5] construction vibrations generally have more intensity at lower frequencies than those from blasting (see road construction example diagram at right). What all this means from the standpoint of damage potential is that resonance effects, particularly the amplifications achieved, on house vibrations caused by construction are virtually unknown and not well accounted for in existing standards.
|
|
|
E-mail to drzeigler@vibrationdamage.com or send online questions or comments about Vibrationdamage.com.
|


 Seismograph software does this kind of calculation automatically to give what is called a "zero
crossing frequency" ("
Seismograph software does this kind of calculation automatically to give what is called a "zero
crossing frequency" ("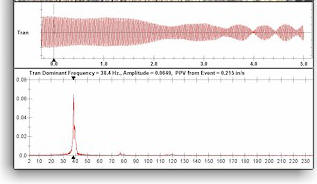 far more accurate and informative method for determining all the frequency
components of a complex wave is the use of Fast Fourier Transform (FFT).
This is a mathematical technique, usually done with a mini or personal computer, in which the
entire waveform of the ground vibration is "fitted" to a whole set of wave component
frequencies, so as to obtain a full analysis of both the frequencies and their intensities
which contribute to the vibration. The effect of the FFT is to convert a vibration intensity vs. time ("time domain") diagram of the vibration into a vibration intensity vs. frequency ("frequency domain") diagram. At right is an
example of time domain (at top) and frequency domain plot of the same vibratory compactor vibration. This one is quite simple in appearance, because the seismograph is detecting the vibration frequency of the compactor used. FFT is extremely powerful and widely
available in seismograph analysis software.
far more accurate and informative method for determining all the frequency
components of a complex wave is the use of Fast Fourier Transform (FFT).
This is a mathematical technique, usually done with a mini or personal computer, in which the
entire waveform of the ground vibration is "fitted" to a whole set of wave component
frequencies, so as to obtain a full analysis of both the frequencies and their intensities
which contribute to the vibration. The effect of the FFT is to convert a vibration intensity vs. time ("time domain") diagram of the vibration into a vibration intensity vs. frequency ("frequency domain") diagram. At right is an
example of time domain (at top) and frequency domain plot of the same vibratory compactor vibration. This one is quite simple in appearance, because the seismograph is detecting the vibration frequency of the compactor used. FFT is extremely powerful and widely
available in seismograph analysis software. 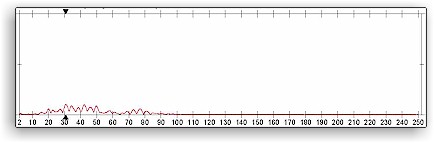 Vibration monitoring reports will often show only the Zero Crossing frequency
of the major vibration component and its velocity (PPV), often without even identifying it as a ZC frequency. This will then be used
as the basis for a claim that the vibration "met the standard" or was "non-damaging".
A comparison of the ZC and FFT frequencies for this vibration is shown in the "milling
cleanup, concrete drop" entry in the table above.
Vibration monitoring reports will often show only the Zero Crossing frequency
of the major vibration component and its velocity (PPV), often without even identifying it as a ZC frequency. This will then be used
as the basis for a claim that the vibration "met the standard" or was "non-damaging".
A comparison of the ZC and FFT frequencies for this vibration is shown in the "milling
cleanup, concrete drop" entry in the table above. 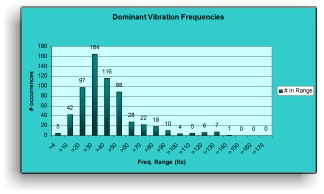 As discussed in some detail on the page,